Tools for monitoring your pipeline
Monitoring the progress via guiHive
GuiHive is a web interface to an eHive database that allows monitoring the state of the pipeline. It displays flow diagrams of all the steps in the pipeline and their relationship to one another. In addition it colours Analyses based on completion and each Analysis has a progress circle which indicates the number of complete, running and failed Jobs. GuiHive also offers the ability to directly modify Analyses, for example you can change the Resource Class used by the Analysis directly through guiHive.
GuiHive is already installed at the Sanger and at the EBI (both for internal use only), but can also be installed locally. Instructions for this are on GitHub
Generating a pipeline’s flow diagram
The generate_graph.pl script is another visualization tool available in eHive. It can be useful for producing diagrams when guiHive is unavailable or cannot connect to the eHive database. To produce a diagram from an eHive database, run:
generate_graph.pl -url sqlite:///my_pipeline_database -out my_diagram.png
You can choose the format (gif, jpg, png, svg, etc.) by setting the output file extension.
Legend:
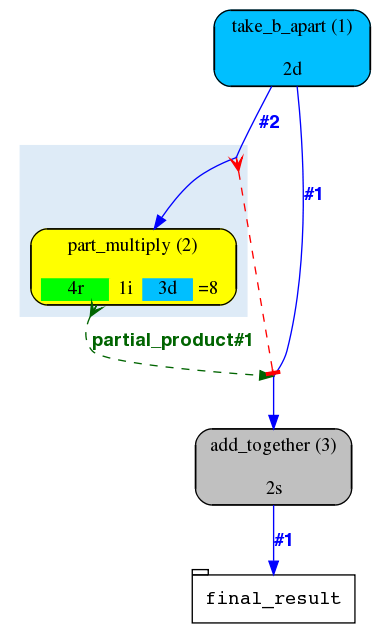
The rounded nodes on the flow diagram represent Analyses (classes of Jobs).
The white rectangular nodes represent tables that hold user data.
The blue solid arrows are called “dataflow rules”. They either generate new Jobs (if they point to an Analysis node) or store data (if they point at a table node).
The red solid arrows with T-heads are “analysis control rules”. They block the pointed-at Analysis until all the Jobs of the pointing Analysis are done.
Light-blue shadows behind some analyses stand for “semaphore rules”. Together with red and green dashed lines they represent our main Job control mechanism that will be described elsewhere.
Each flow diagram thus generated is a momentary snapshot of the pipeline state, and these snapshots will be changing as the pipeline runs. One of the things changing will be the colour of the Analysis nodes. The default colour legend is as follows:
[ EMPTY ] : the Analysis never had any Jobs to do. Since pipelines are dynamic it may be OK for some Analyses to stay EMPTY until the very end.
[ DONE ] : all Jobs of the Analysis are DONE. Since pipelines are dynamic, it may be a temporary state, until new Jobs are added.
[ READY ] : some Jobs are READY to be run, but nothing is running at the moment.
[ IN PROGRESS ] : some Jobs of the Analysis are being processed at the moment of the snapshot.
[ BLOCKED ] : none of the Jobs of this Analysis can be run at the moment because of Job dependency rules.
[ FAILED ] : the number of FAILED Jobs in this Analysis has gone over a threshold (which is 0 by default). By default
beekeeper.plwill exit if it encounters a FAILED Analysis.
Another thing that will be changing from snapshot to snapshot is the Job “breakout” formula displayed under the name of the Analysis. It shows how many Jobs are in which state and the total number of Jobs. Separate parts of this formula are similarly colour-coded:
__s (SEMAPHORED) - individually blocked Jobs
__r (READY) - Jobs that are ready to be claimed by Workers
__i (IN PROGRESS) - Jobs that are currently being processed by Workers
__d (DONE) - successfully completed Jobs
__f (FAILED) - unsuccessfully completed Jobs
generate_graph.pl can also create a diagram directly from a PipeConfig file, with no
pipeline database needed:
generate_graph.pl -pipeconfig Bio::EnsEMBL::Hive::Examples::LongMult::PipeConfig::LongMult_conf -out my_diagram2.png
Such a “standalone” diagram may look slightly different (analysis_ids will be missing).
Monitoring the progress via a direct database session
In addition to monitoring the visual flow diagram (that could be
generated manually using
generate_graph.pl or via the
guiHive web interface), you can also connect to the pipeline database
directly and issue SQL commands. To avoid typing in all the connection
details (syntax is different depending on the particular database engine
used) you can use a bespoke db_cmd.pl
script that takes the eHive database URL and performs the connection for
you:
db_cmd.pl -url $EHIVE_URL
Once connected, you can list the tables and views with SHOW TABLES;.
The default set of tables should look something like:
+----------------------------+
| Tables_in_hive_pipeline_db |
+----------------------------+
| accu                       |
| analysis_base              |
| analysis_ctrl_rule         |
| analysis_data              |
| analysis_stats             |
| dataflow_rule              |
| hive_meta                  |
| job                        |
| job_file                   |
| log_message                |
| msg                        |
| pipeline_wide_parameters   |
| progress                   |
| resource_class             |
| resource_description       |
| resource_usage_stats       |
| role                       |
| worker                     |
| worker_resource_usage      |
+----------------------------+
Some of these tables, such as analysis_base, job and
resource_class may be populated with entries depending on what is in
you configuration file. At the very least you should expect to have your
analyses in analysis_base. Some tables such as log_message will
only get populated while the pipeline is running (for example
log_message will get an entry when a Job exceeds the memory limit
and dies).
Please refer to the eHive schema (see eHive schema diagram and eHive schema description) for details on these tables and their relations.
In addition to the tables, there are a number of views which summarize the activity and progression of work across the Analyses in a pipeline.
First of all, beekeeper_activity shows all the registered beekeepers,
with some information about the number of loops they executed, when they
were last seen, etc. The example query here lists the beekeepers that are
alive and the ones that have “disappeared” (i.e. likely interrupted with
Ctrl+C).:
> SELECT * FROM beekeeper_activity WHERE cause_of_death IS NULL OR cause_of_death = "DISAPPEARED";
+--------------+-------------+-----------------------+---------------+------------+------------+----------------+----------------+---------------------+---------------------------+------------+
| beekeeper_id | meadow_user | meadow_host           | sleep_minutes | loop_limit | is_blocked | cause_of_death | loops_executed | last_heartbeat      | time_since_last_heartbeat | is_overdue |
+--------------+-------------+-----------------------+---------------+------------+------------+----------------+----------------+---------------------+---------------------------+------------+
|            1 | muffato     | ebi-cli-002.ebi.ac.uk |             1 |       NULL |          0 | DISAPPEARED    |              7 | 2018-05-12 22:55:05 | NULL                      |       NULL |
|            3 | muffato     | ebi-cli-002.ebi.ac.uk |             1 |       NULL |          0 | DISAPPEARED    |             26 | 2018-05-12 23:22:37 | NULL                      |       NULL |
|            4 | muffato     | ebi-cli-002.ebi.ac.uk |             1 |       NULL |          0 | DISAPPEARED    |             86 | 2018-05-13 00:48:45 | NULL                      |       NULL |
|           11 | muffato     | ebi-cli-002.ebi.ac.uk |             1 |       NULL |          0 | DISAPPEARED    |           2425 | 2018-05-15 14:01:24 | NULL                      |       NULL |
|           19 | muffato     | ebi-cli-002.ebi.ac.uk |             1 |       NULL |          0 | DISAPPEARED    |              3 | 2018-05-19 10:44:10 | NULL                      |       NULL |
|           20 | muffato     | ebi-cli-002.ebi.ac.uk |             1 |       NULL |          0 | NULL           |           3180 | 2018-05-21 16:00:17 | 00:00:57                  |          0 |
+--------------+-------------+-----------------------+---------------+------------+------------+----------------+----------------+---------------------+---------------------------+------------+
Then, you can dig a bit further into the list of what is running with the
live_roles table:
> SELECT * FROM live_roles;
+-------------+-------------+-------------------+---------------------+-------------+---------------------------------------+----------+
| meadow_user | meadow_type | resource_class_id | resource_class_name | analysis_id | logic_name                            | count(*) |
+-------------+-------------+-------------------+---------------------+-------------+---------------------------------------+----------+
| mateus      | LSF         |                 7 | 2Gb_job             |          88 | hmm_thresholding_searches             |     1855 |
| mateus      | LSF         |                14 | 8Gb_job             |          89 | hmm_thresholding_searches_himem       |       10 |
| mateus      | LSF         |                18 | 64Gb_job            |          90 | hmm_thresholding_searches_super_himem |        1 |
| muffato     | LSF         |                 7 | 2Gb_job             |          88 | hmm_thresholding_searches             |      929 |
| muffato     | LSF         |                14 | 8Gb_job             |          89 | hmm_thresholding_searches_himem       |        2 |
| muffato     | LSF         |                18 | 64Gb_job            |          90 | hmm_thresholding_searches_super_himem |        7 |
+-------------+-------------+-------------------+---------------------+-------------+---------------------------------------+----------+
This example shows a “collaborative” run of the pipeline, with two users running about 2,900 jobs.
Finally, the “progress” view tells you how your jobs are doing:
> SELECT * FROM  progress;
+----------------------+----------------+--------+-------------+-----+----------------+
| analysis_name_and_id | resource_class | status | retry_count | cnt | example_job_id |
+----------------------+----------------+--------+-------------+-----+----------------+
| chrom_sizes(1)       | default        | DONE   |           0 |   1 |              1 |
| base_age_factory(2)  | 100Mb          | DONE   |           0 |   1 |              2 |
| base_age(3)          | 3.6Gb          | DONE   |           0 |  25 |              4 |
| big_bed(4)           | 1.8Gb          | DONE   |           0 |   1 |              3 |
+----------------------+----------------+--------+-------------+-----+----------------+
If you see Jobs in [ FAILED ] state or Jobs with retry_count > 0 (which means they have failed at least once and had to be retried), you may need to look at the “msg” view in order to find out the reason for the failures:
SELECT * FROM msg WHERE job_id=1234; # a specific Job
or
SELECT * FROM msg WHERE analysis_id=15; # Jobs of a specific Analysis
or
SELECT * FROM msg; # show me all messages
Some of the messages indicate temporary errors (such as temporary lack of connectivity with a database or file), but some others may be critical (wrong path to a binary) that will eventually make all Jobs of an Analysis fail. If the “is_error” flag of a message is false, it may be just a diagnostic message which is not critical.
Monitoring the progress via guiHive
GuiHive is a web-interface to a eHive database that allows to monitor the state of the pipeline. It displays flow diagrams of all the steps in the pipeline and their relationship to one another. In addition it colours Analyses based on completion and each Analysis has a progress circle which indicates the number of complete, running and failed Jobs. guiHive also offers the ability to directly modify analyses, for example you can change the Resource Class used by the Analysis directly through guiHive.
guiHive is already installed at the Sanger and at the EBI (both for internal use only), but can also be installed locally. Instructions for this are on GitHub